Gross Hydropower Potential
Why is the content of this map important?
Hydropower provides 20% of the EU’s electricity needs and represents 70% of the renewable energy production. In the coming decades, the increasing share of intermittent renewable energies (mainly solar and wind) in the electricity mix will make the electricity supply-demand balance more challenging. Due to its adjustable nature, hydropower will play a key role in achieving this supply-demand balance.
Which sectors are affected by this result?
The hydropower sector and the electricity sector as a whole may be affected by changes in the gross hydropower potential.
What is shown on the maps?
Northern and northeastern European countries are projected to be impacted positively by climate change with regard to gross hydropower potential. Increases in annual mean gross hydropower potential by 10% to 20% are projected. Gross hydropower potential is projected to hardly vary in some countries, such as France and Great Britain. Southern European countries, especially the Iberian Peninsula and Greece, are projected to experience a decrease in gross hydropower potential by 5 to 10%.
Details and further information:
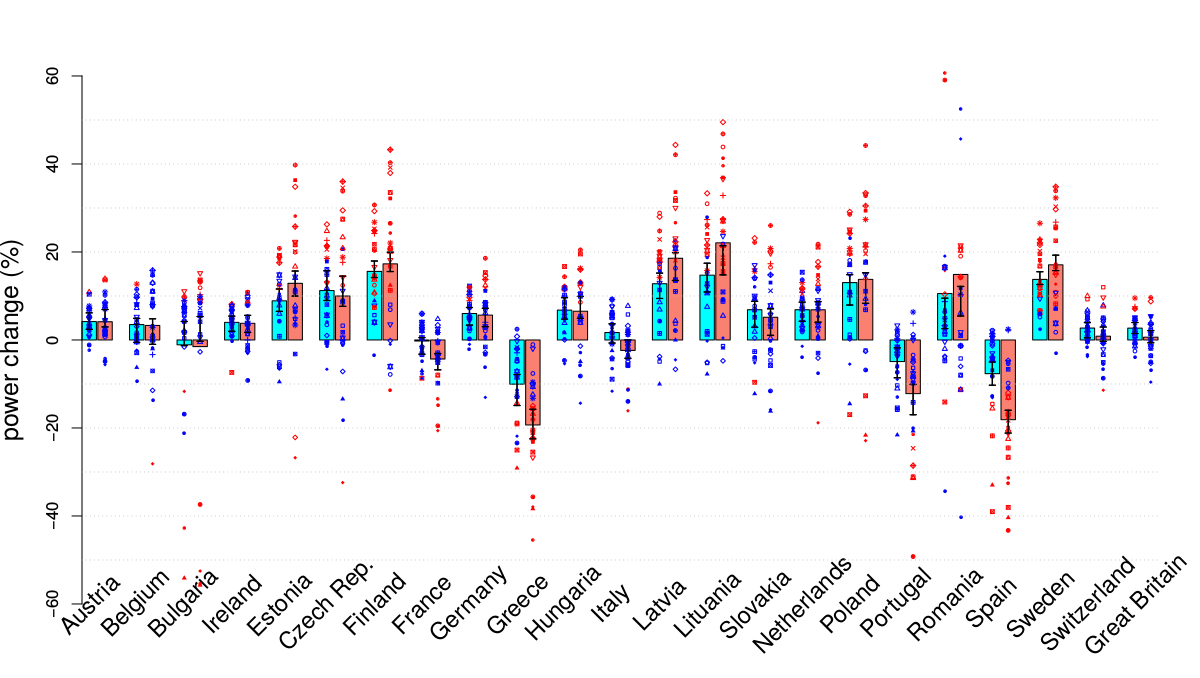
The assessment is based on five hydrological models in combination with five climate model simulations. On average, a global warming by 2°C or 3°C is projected to result in similar changes in hydropower potential in several countries. However, for others changes could double (see Figure). The spread among the models is large. For some countries (e.g. Spain, Greece, Lituania, Finland), models project decreasing as well as increasing values with magnitudes of beyond 30 to 40%.
 and +3°C (salmon) global warming. Changes are expressed
in percents with respect to the recent 1971-2000 period. The colored wide
bars indicate the model ensemble mean. The thin bars indicate the 95% level
confidence interval as computed using the Wilcoxon-Mann-Whitney test. Model
individual changes are represented by differing symbols: symbols are red when
changes are significant at the 95% level using the Wilcoxon-Mann-Whitney test.")
The effects of +2°C global warming on the hydropower sector have been assessed using the gross hydropower potential (GHP) quantity, which corresponds to the energy available if all runoff were converted into power at all locations. Future changes in GHP have been assessed at the national scale. The ensemble of five hydrological models (LISFLOOD, LPJml, VIC, WBM and E-HYPE) was forced by outputs of the ensemble of the five mandatory climate simulations. Hence, the ensemble consists of 25 simulations in total.
The Mann-Witney-Wilcoxon test has been applied to assess the significance of the projected changes under +2°C global warming. The results are found not significant (at 95% confidence level) over some regions, which means that the assessed changes cannot be distinguished from natural interannual variability.
Due to computational issues, the results for Luxemburg, Croatia, Serbia and Romania could not be shown.
Author:
Isabelle Tobin
Centre national de la recherche scientifique (CNRS-IPSL), France