Ecosystem Services Adaptive Capacity
Why is the content of this map important?
When talking about extreme events, thinking beyond biophysical impacts is important. The vulnerability of people or regions to extreme events is affected by ecosystem services adaptive capacity; areas high in AC are more likely to cope with and adapt to future changes in extremes.
Which sectors are affected by this result?
Adaptive capacity has important implications for the vulnerability of the ecosystem services sector to future climate change, which can have impacts on e.g. tourism and recreation as well as services such as long-term carbon storage.
What is shown on the maps?
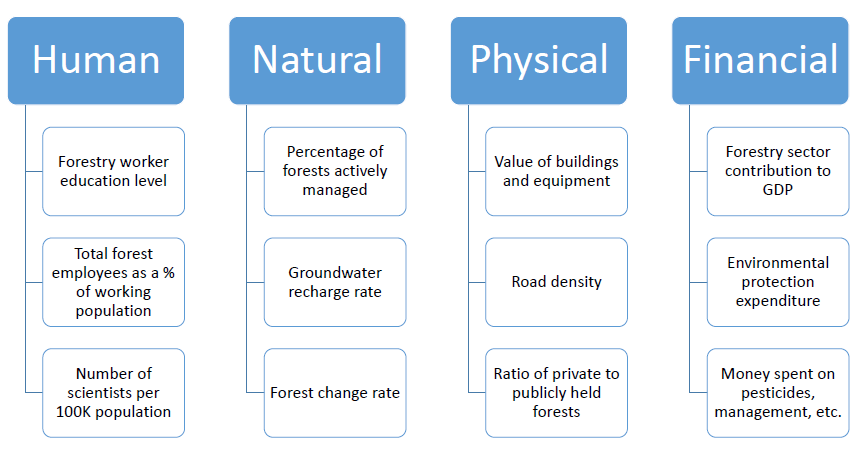
The map shows an index created by adding capital indices for human, physical, natural, and financial capitals, with the maximum index value of five and minimum of zero. Each separate capital consists of three indicators of the ecosystem services adaptive capacity (AC). The information behind the map can be used to highlight areas which may be vulnerable now and in the future, by combining our estimates with impacts to create an estimate of vulnerability.
We have portrayed results in line with previous assessments for the global and EU level, aggregating indicators of the 4 capitals to form an index ranging between 0 and 4, for which we employed equal weighting for each capital. This measures the ability of the ecosystem services to cope with future climate-related changes.
Details and further information:
Below is a simple overview of the indicators used to define each capital value for ecosystem services adaptive capacity. Data were obtained from the EU’s Eurostat, the FAO, and the World Bank. Data limitations require the use of current adaptive capacity as a proxy for future AC, as no statistically significant model to project AC to the future could be determined.

The four capitals approach has been used to assess adaptive capacity. It is a combination of human, physical, natural, and financial capitals. The output of the EPIC model was analyzed. EPIC was driven by the five mandatory climate simulations. Hence, the ensemble consists of 5 simulations in total.
Author:
Keith Williges
International Institute for Applied Systems Analysis (IIASA)