The +2 °C Global Warming Period Concept
To examine the impact of a +2°C global warming for the various sectors and regions, several dedicated model chains are applied within IMPACT2C. In general these chains consist of General Circulation Models (GCMs), Regional Climate Models (RCMs), impact models and assessment models.
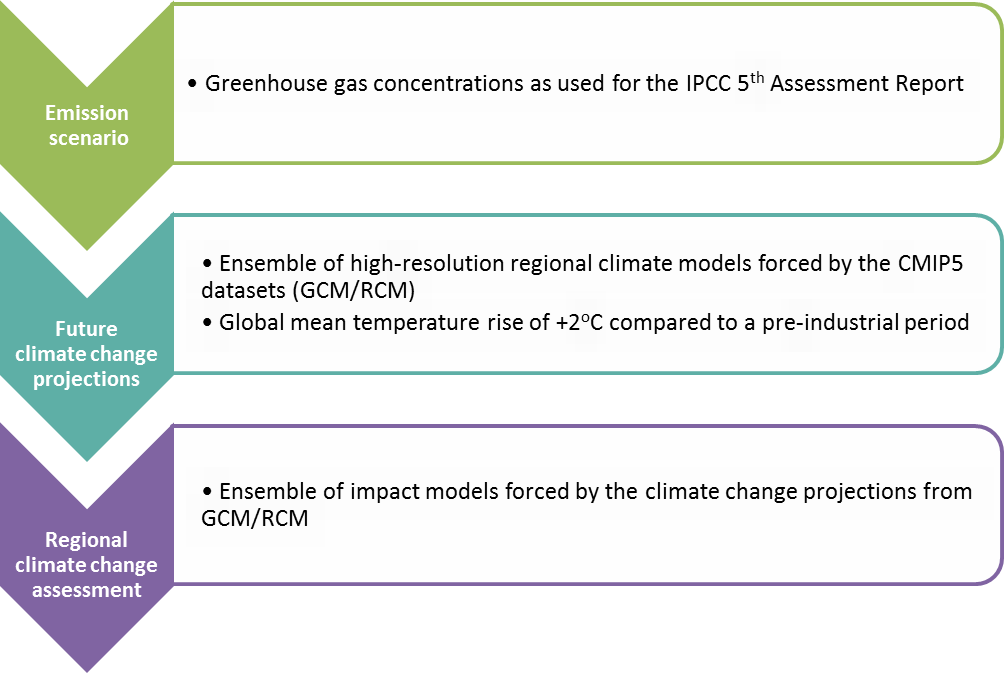
The GCM simulations have been conducted within the Coupled Model Intercomparison Project Phase 5 (CMIP5)1 representing various scenarios of greenhouse gas emission pathways. The data of the GCM simulations are then used as driving data for RCM projections. For this purpose, simulated atmospheric temperature, moisture and wind fields as well as the sea surface temperature from the GCMs are utilized as lateral and lower boundary conditions driving the RCM simulations. Finally, the data of the downscaled climate simulations are used as input for impact and assessment models, like for example process based hydrological models or crop models as well as for statistical regression models. For these model simulations mainly near surface parameters, like near surface air temperature, precipitation fields, humidity, wind and radiation are used. A schematic of the general methodological pathway applied in IMPACT2C is provided in Figure Generalized methodological pathway.
![]()
In order to define a common +2°C global warming period used within the IMPACT2C project the following procedure was applied:
- The RCP4.5 scenario (RCP stands for Representative Concentration Pathway) - representing a stabilization scenario - is used as mandatory greenhouse gas emission scenario.
- The ensemble of CMIP5 temperature projections under the mandatory RCP4.5 scenario has been analyzed to define 30-year time periods, during which the projected global mean temperature increase of the individual model simulations cross the +2°C target compared to pre-industrial times (1881–1910 period). The year of crossing this threshold thereby indicates the central year within this 30-year time period (see Figure on global mean temperature change). Although this year varies among the GCM simulations, the respective periods represent the GCM specific climate conditions under a +2°C global warming.
- To characterize the full spread of possible climate conditions under +2°C global warming five GCM simulations have been selected from the entire ensemble and downscaled with a set of four RCMs; representing the regional climate modelling groups participating in IMPACT2C. Thereby, a multi-model GCM-RCM matrix has been established that allows for providing information on the magnitude of projected changes as well as on the bandwidth of changes.
- Although the IMPACT2C +2°C global warming periods vary in time, it was important to assume a representative time period in order to apply socio-economic assumptions for the +2°C global warming period (along the Shared Socioeconomic Pathways - SSPs). If justified methodologically, the time period from 2035 to 2064 was used for all sectoral and cross-sectoral analyses within IMPACT2C.
 and simulated evolution of global
mean near surface temperatures. Future projections from different GCMs are
based on the RCP4.5 emission scenario. The time series are smoothed using a
30-year running mean. The +2°C global warming threshold is marked by the
horizontal red line. The year of crossing the +2°C global warming threshold
indicates the central year within a 30 year time period.")

The resulting set of downscaled RCM projections, the forcing GCM simulations and respective time periods is summarized in Table 1. In the atlas, this set of downscaled climate simulations is referred to as mandatory climate simulations. Further information on the selection of the mandatory simulations can be found in the IMPACT2C Policy Brief No.1.
The final ensemble available for the IMPACT2C impact assessment studies consists of the five mandatory climate simulations as input for the impact models. Depending on the number of subsequent impact models applied, the resulting ensemble of climate change impact simulations could increase up to a maximum of 25 ensemble members (e.g. analyses using five hydrological impact models).
Exceptions to this ensemble are the ”Coastal Themes” and ”Health” assessments. For the ”Coastal Themes”, sea level information has been taken from a single coupled GCM (HadGEM2-ES) only and other time periods have been considered due to the delayed reaction of the sea-level to a global warming (for details see story on “Coastal Themes“). For the “Health” topics related to air pollution, four chemistry-transport models have been applied (for details see story on “Health“).
Additionally, the ensemble used for the non-European hotspot regions has been adjusted. While the same approach has been applied to define the +2°C global warming period, a different set of downscaled simulations has been analyzed. For details see the respective non-European hotspot story.
In order to use the mandatory climate simulations as input for climate change impact assessment studies the data have been bias corrected using the well-established and widely applied quantile mapping bias correction method2.
| RCM | Global Climate Models | 2°C periods |
| CSC-REMO | MPI-ESM-LR-r1 | 2050-2079 |
| IPSL-INERIS-WRF331F | IPSL-CM5A-MR-r1 | 2028-2057 |
| SMHI-RCA4 | HadGEM2-ES-r1 | 2023-2052 |
| KNMI-RACMO22E | EC-EARTH-r1 | 2042-2071 |
| SMHI-RCA4 | EC-EARTH-r12 | 2042-2071 |
In addition, the impact of a +3°C global warming has been analyzed for selected topics. To define the +3°C period, the identical concept has been applied as for the +2°C global warming. However, temperature time series from GCM simulations for the RCP8.5 emission scenario have been used to identify the time period when crossing the +3°C global warming target. The selection of GCM simulations following the RCP8.5 emission scenario became necessary since the +3°C was not reached within all of the above-mentioned temperature projections under RCP4.5. From the GCM ensemble, four simulations have been selected and downscaled with four RCMs to provide the input data for the subsequent impact assessments. Table 2 summarizes the resulting set of downscaled RCM projections, forcing GCM simulations and respective time periods for the +3°C global warming analyses.
| RCM | Global Climate Models | 3°C periods |
| CSC-REMO | MPI-ESM-LR-r1 | 2053-2082 |
| SMHI-RCA4 | HadGEM2-ES-r1 | 2037-2066 |
| KNMI-RACMO22E | EC-EARTH-r1 | 2052-2081 |
| SMHI-RCA4 | EC-EARTH-r12 | 2052-2081 |
1 For reasons of consistency, only simulations based on RCPs (slow-track activity) are considered in the atlas. In several IMPACT2C project deliverables, also simulations from the EU-ENSEMLES project (fast-track activity) have been used.
2 For more details on the method, see the open-access publication of Gobiet, A., Suklitsch, M., and Heinrich, G.: The effect of empirical-statistical correction of intensity-dependent model errors on the temperature climate change signal, Hydrol. Earth doi:10.5194/hess-19-4055-2015, 2015.