Solar Photovoltaics Potential
Why is the content of this map important?
The solar photovoltaics (PV) industry has experienced rapid growth in recent years. Changes in climate variables such as cloudiness, solar radiation, and temperature can affect the potential for PV power generation. Therefore, such impacts need to be assessed in the context of rapid PV deployment.
Which sectors are affected by this result?
The PV sector, and more broadly the electricity sector, are vulnerable to changes in climate variables, such as solar radiation and temperature. The assessment of changes in PV potential is informative for planning and executing activities in the PV industry. It may also be beneficial for energy-climate policy makers.
What is shown on the maps?
The PV potential exhibits a positive gradient from northern to southern Europe, consistently with the solar resource. According to most models, decreases in mean annual PV potential are highlighted over most of Europe, reaching magnitudes of 5 to 10% decrease in northern countries. There is an exception in southern countries where changes can not be distinguished from natural climate variations. Overall, changes in PV potential are consistent with the pattern of changes in solar resources. However, in southern European countries, the PV cell efficiency loss due to a projected temperature increase outweighs the projected increase in solar resources.
Details and further information:
According to most models, the annual power generation potential of PV power plants currently installed is projected to decrease for most European countries (see Figure). These energy yield losses, however, are projected to be smaller than 5% in magnitude. Global warming by 3°C (salmon color) leads to slightly stronger changes than global warming by 2°C (cyan color).
Changes in additional factors such as aerosols could impact on PV generation potential and need to be considered likewise. However, this is not part of this study.
 and +3°C (salmon) global warming. Changes are expressed in percents with respect to the 1971-2000 reference period. The colored wide bars indicate the model ensemble mean. The thin bars indicate the 95% level confidence interval as computed using the Wilcoxon-Mann-Whitney test. Model individual changes are represented by differing symbols: symbols
are red when changes are significant at the 95% level using the Wilcoxon-Mann-Whitney test.")
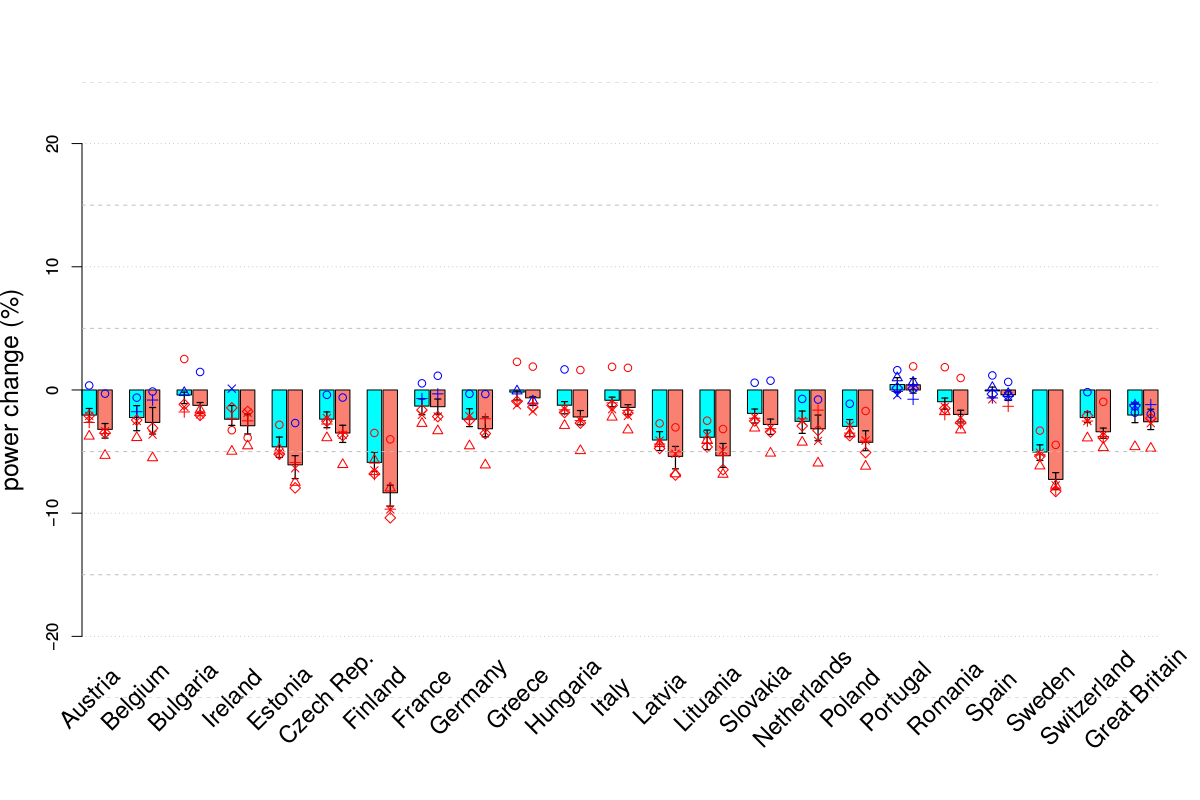
The effects of +2°C global warming on the solar photovoltaic (PV) sector have been assessed both in terms of PV power potential at the grid point scale over Europe and in terms of PV power production as generated by current and planned PV plants at the national level for the different European countries.
The results are derived based on surface incoming solar radiation, 2m temperature and 10m wind speed data from the five mandatory climate simulations. Hence, the ensemble consists of 5 simulations in total.
Author:
Isabelle Tobin
Centre national de la recherche scientifique (CNRS-IPSL), France