Snow Season Length
Why is the content of this map important?
A warmer climate is connected to fewer days with snow. Snow season length is an important factor for winter tourism activities. Changes in snow cover also pose a substantial impact to the hydrological cycle and fresh water availability.
Which sectors are affected by this result?
Winter tourism resorts are dependent on having enough snow to maintain the slopes for sports. In many areas the snow season is already relatively short, which means that the related economies depend on the snow conditions to keep resorts open. Additionally, the water and energy sectors are going to be affected.
What is shown on the maps?
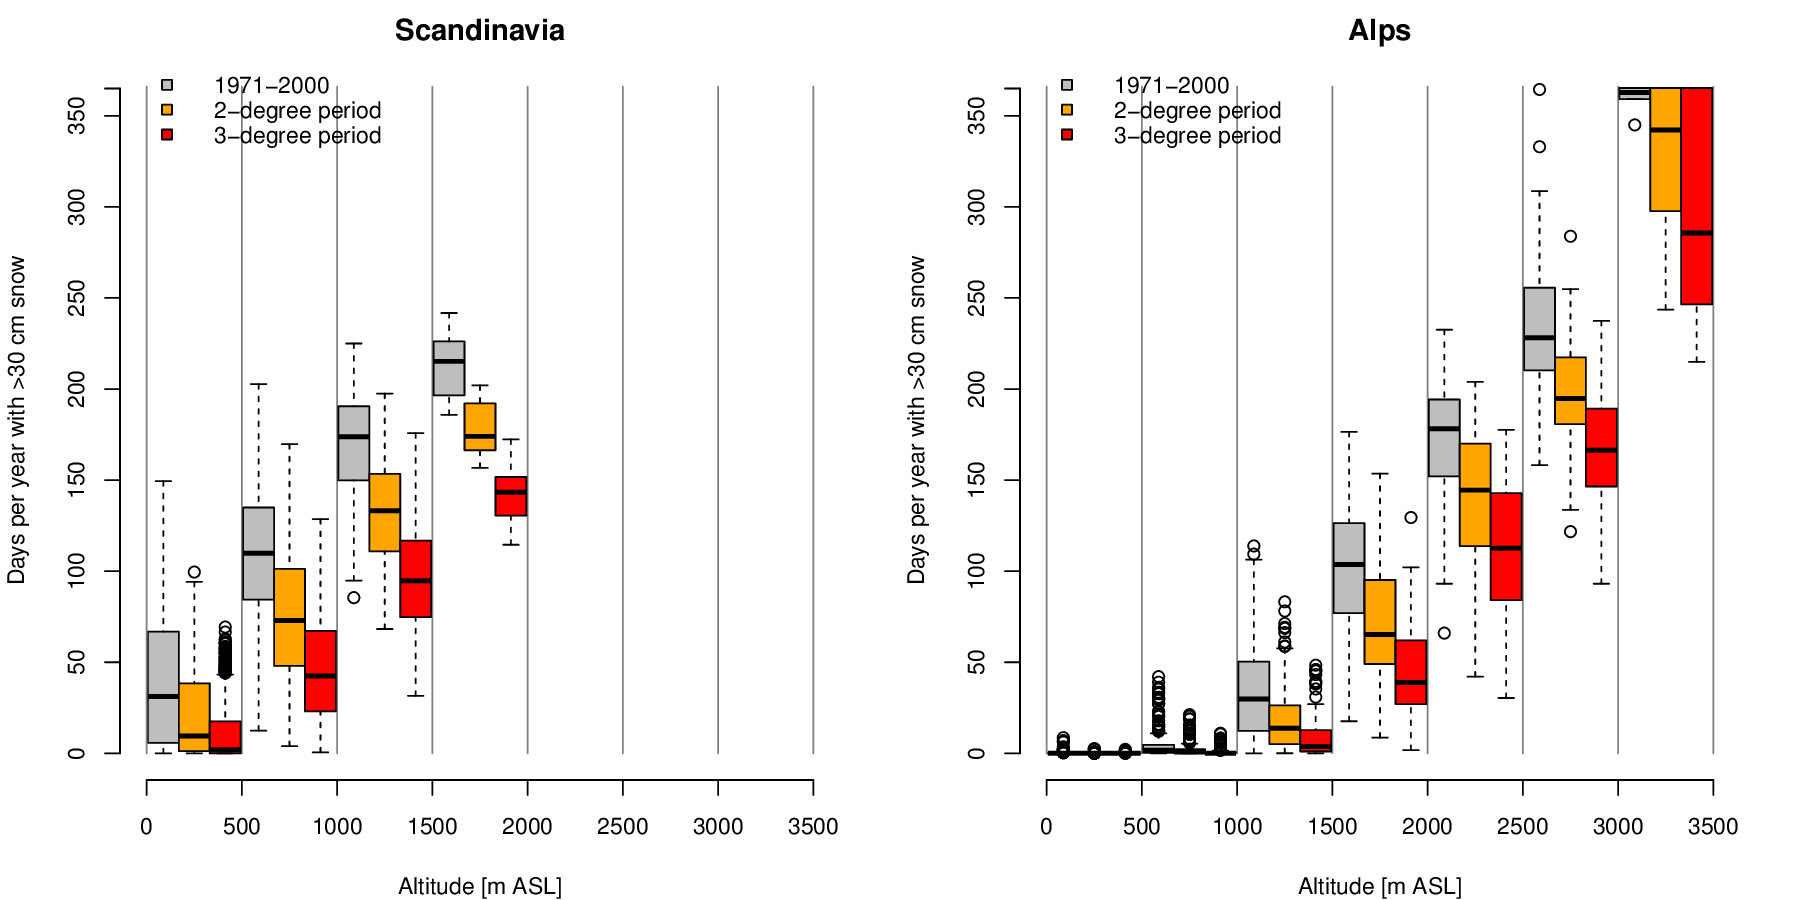
On the maps, the number of days per year with more than 30 cm snow pack (120 mm water equivalent) are shown for the 1971-2000 reference period and the +2°C global warming period. In the maps showing the climate change signal, the relative change of the snow season length is shown for the +2°C and +3°C global warming periods. For example, a value of -40% indicates that the future period is projected to have 40% less days with more than 30 cm snow. As can be seen, most areas are going to lose a considerable part of the season. The change in snow season looks different at different altitudes. Lowland areas are projected to see a larger share of their snow days disappear, but even the highest Alpine areas indicated changes in the future.
Details and further information:
The data was produced using a hydrological model driven by regional and global climate models. The model ensemble consists of 11 different simulations for the 1971-2000 reference and +2°C global warming periods and five simulations for the 3°C period.
Number of days with >30 cm snow per year, shown at different altitudes in 500 meter intervals. The gray boxes show the reference period (1971-2000) while the orange and red boxes show the 2°C and +3°C global warming periods, respectively.
The VIC model was driven by the ensemble of the five mandatory climate simulations plus six additional simulations for RCP2.6 and RCP8.5 (also representing +2°C global warming periods). Hence, the ensemble consists of 11 simulations in total.
Author:
Oskar Landgren
Meteorologisk Institutt (MET.NO), Norway